To reveal the countries with the highest total foreign direct investment (FDI), per capita inflows, and notable year-over-year changes, the team at BestBrokers conducted a comprehensive analysis of World Bank data from 2023 and 2024. By calculating FDI growth rates and normalising the figures on a per capita basis using 2024 population data, we developed detailed rankings that highlight emerging investment patterns and shifts in the global economic landscape.
In 2024, the United States led global foreign direct investment with USD 387.9 billion in inflows, followed by Singapore with USD 151.9 billion and Hong Kong with USD 117 billion. On a per capita basis, smaller nations stand out: Malta and Antigua and Barbuda top the list with USD 3,028 and USD 2,886 in foreign investment attracted per resident, respectively.
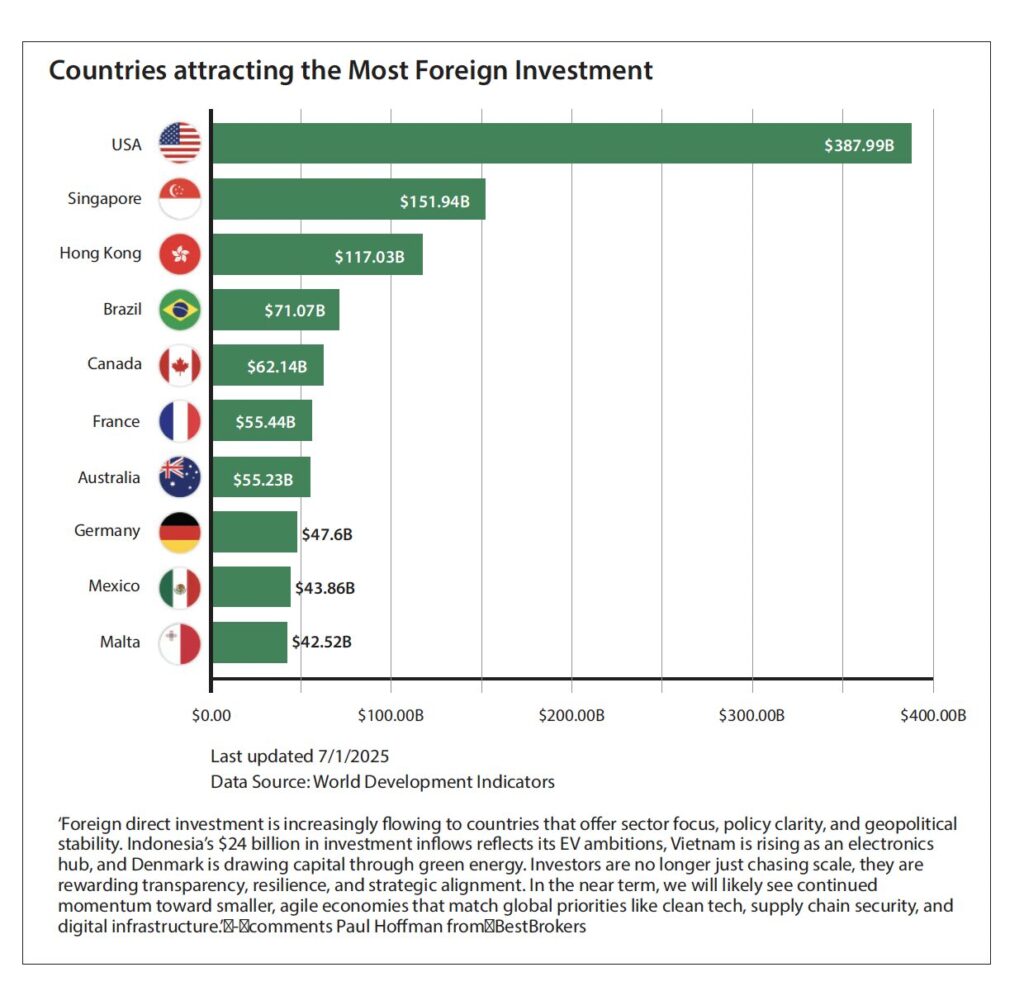
Countries with the largest total foreign investments in 2024:
United States – USD 387.99 B
Singapore – USD 151.94 B
Hong Kong – USD 117.03 B
Brazil – USD 71.07 B
Canada – USD 62.14 B
France – USD 55.44 B
Australia – USD 55.23 B
Germany – USD 47.6 B
Mexico – USD 43.86 B
Malta – USD 42.52 B
Countries with the most foreign investments per capita in 2024:
Malta – USD 74,034.82
Singapore – USD 25,168.88
Hong Kong – USD 15,553.62
Denmark – USD 3,028.27
Antigua and Barbuda – USD 2,886.09
Sweden – USD 2,525.19
Australia – USD 2,030.14
Grenada – USD 1,925.92
Bahrain – USD 1,701.21
Israel – USD 1,685.16
Countries where foreign investments increased the most between 2023 and 2024:
Slovak Republic (+1192.74 percent)
Belize (+697.38 percent)
Finland (+680.85 percent)
France (+529.72 percent)
Denmark (+295.47 percent)
Timor-Leste (+265.91 percent)
Austria (+218.14 percent)
Qatar (+197.05 percent)
Brunei Darussalam (+151.97 percent)
Tajikistan (+107.22 percent)
Countries where foreign investments decreased the most between 2023 and 2024:
Belgium (-1181.25 percent)
Tonga (-345.21 percent)
Estonia (-165.40 percent)
Kazakhstan (-111.71 percent)
Armenia (-76.13 percent)
United Kingdom (-74.58 percent)
Kuwait (-70.94 percent)
Norway (-70.16 percent)
Iceland (-67.92 percent)
China (-63.86 percent)
Other facts and figures from our research:
The United States remains the top destination for foreign direct investment in 2024, drawing USD 387.9 billion in inflows, representing a modest 11.2 percent increase compared to the previous year. However, when measured on a per capita basis, the picture shifts: with just USD 1,140 invested per resident, the U.S. ranks 18th globally, well behind several smaller but more investment-dense economies.
Following the United States, Singapore and Hong Kong rank as the second and third largest recipients of foreign direct investment in 2024, attracting USD 151.9 billion and USD 117 billion, respectively.
Both record significantly higher per capita figures – USD 25,169 for Singapore and USD 15,554 for Hong Kong. Brazil ranks fourth with USD 71 billion in FDI, though this amounts to just USD 335 per resident.
Switzerland recorded the largest negative total foreign direct investment in 2024, with an outflow of -USD 112.1 billion following a 26 percent year-over-year decline, likely driven by capital repatriation and shifts in global investment flows.
With USD 74,035 in foreign direct investment per resident, Malta ranks first globally in per capita FDI for 2024. This figure reflects a sharp 69.1 percent increase in total investment year-over-year, rising from USD 25.1 billion in 2023 to USD 42.5 billion.
In comparison, Singapore holds second place with USD 25,169 per resident (three times lower), following a more measured annual growth rate of 14.7 percent.
The Slovak Republic saw the most significant surge in foreign direct investment, with an extraordinary 1,193 percent year-over-year increase, climbing from a negative USD 328 million to USD 3.58 billion. Conversely, Belgium experienced the steepest decline, as FDI plummeted by 1,181.25 percent, falling from -USD 2.78 billion to -USD 35.57 billion.
Shifting Currents: The Changing Landscape of Global Foreign Direct Investment
Long regarded as a cornerstone of global economic growth, foreign direct investment (FDI) has driven infrastructure development, job creation, and technological progress. However, the landscape has shifted dramatically in recent years.
In 2023 and 2024, global FDI flows declined sharply, reaching historic lows across both developing and advanced economies amid rising trade barriers and geopolitical uncertainties.
Yet amid these challenges, certain regions are defying the trend by attracting substantial foreign investment. The United Kingdom has recently made headlines as the most attractive destination in Europe for investment, whereas in the United States, foreign capital is returning to strategic sectors such as real estate, exemplified by Saudi Arabia’s Public Investment Fund’s USD one billion acquisition near Central Park. Meanwhile, Russia is seeking to offset Western sanctions by introducing investor-friendly accounts with withdrawal guarantees to attract foreign capital.
Prompted by these evolving dynamics, the research team at BestBrokers analysed foreign direct investment data for 107 countries, sourced from the World Bank, to identify those with the highest total and per capita FDI, and to explore the impact of negative FDI on select nations.
Key Takeaways:
Malta leads globally in foreign direct investment per capita, with an impressive USD 74,035 invested per citizen.
The Slovak Republic recorded the most dramatic year-over-year growth in FDI, soaring by 1,193 percent.
In 2024, the United States attracted the highest total volume of foreign direct investment, reaching USD 387.99 billion.
Per capita foreign investment reveals surprising leaders and strategic hotspots in 2024.
The small Mediterranean nation of Malta attracted the highest foreign direct investment per capita in 2024, drawing USD 74,035 per resident, a 69.1 percent increase from the previous year. This surge in FDI, from USD 25.1 billion to USD 42.5 billion, is likely driven by Malta’s competitive corporate tax rates, EU membership, and its emergence as a hub for blockchain and digital finance services.
Similarly, Singapore records substantial inflows at USD 25,169 per person, up nearly 15 percent, supported by strong government incentives, world-class port infrastructure, and a strategic position as Southeast Asia’s financial and trade centre. Meanwhile, Hong Kong sees USD 15,554 per capita despite a 4.1 percent decline, reflecting ongoing investor caution amid political unrest.
Some large economies like the United States and Canada exhibit strong growth but more moderate per capita
The research team at BestBrokers analysed foreign direct investment data for 107 countries, values around USD 1,100 to USD 1,500, as their sizable populations dilute per-person investment, despite substantial total volumes.
China and India, with their vast and rapidly evolving markets, register even lower figures at USD 13.17 and USD 19.03, respectively.
Small island nations like Antigua and Barbuda, and St. Kitts and Nevis stand out for their high investment per capita, highlighting how financial services or tax policies attract foreign capital disproportionate to their populations.
Global investment in 2024 confirms where economic power is concentrated and where it’s shifting.
The United States asserts its dominance with foreign investments totalling USD 388 billion, more than twice that of second-place Singapore at USD 151 billion.
This gap alone surpasses the combined foreign investment of the next two countries on the list: Hong Kong with USD 117 billion and Brazil with USD 71 billion.
Meanwhile, China, the world’s second-largest economy by GDP, reported just USD 18.6 billion, barely edging out Poland.
For a country of China’s scale, that figure is unexpectedly low. It suggests a strategic pivot: Beijing is increasingly focusing on outbound investment and domestic self-sufficiency, rather than courting foreign capital.
Across the Atlantic, France attracts USD 55 billion, an enormous increase of 530 percent compared to 2023’s USD 8.8 billion.
Meanwhile, Sweden, with just 10 million people, draws USD 26.7 billion fueled by green tech, and even smaller Denmark secures USD 18.1 billion through clean energy and pharmaceutical investments. Beyond the West, rising players are redrawing the map. Indonesia drew in USD 24.1B on EV supply chains, Vietnam brought USD 20.1B as a key electronics hub, and Israel secured USD 16.8B, driven by tech and defence, despite its small size.
The biggest swings in foreign investment in 2024 tell a story of shifting global confidence.
The Slovak Republic saw a jaw-dropping increase of 1,193 percent, swinging from a negative USD 328 million in 2023 to over USD 3.58 billion in 2024, a turnaround that suggests a major influx of foreign capital, likely tied to large-scale industrial investments or restructuring within key export sectors.
France surged 530 percent to over USD 55 billion, signalling renewed investor trust in its industrial and energy sectors. Denmark nearly quadrupled its inflows, while Belize, though small, posted a 697 percent jump, the second-largest percentage gain of any country.
On the losing end, China’s 64 percent drop highlights its changing investment climate. Estonia collapsed 165 percent into the red, and Belgium posted a staggering 1,181 percent decline, suggesting major pull outs or project halts.
The message is clear: global capital is flowing in bold new directions, toward stability, strategy, and sector strength.
Countries with Negative FDI per capita: What it means and why it matters
Negative FDI means more money is leaving a country than coming in, often due to profit repatriation, asset sales, or shifting investor confidence. It can signal trouble but also financial reshuffling.
Switzerland’s huge negative FDI per capita (over USD 12,400) reflects profit shifting and capital repatriation for tax reasons. Belgium and Hungary, on the other hand, face negative results due to multinational restructuring and EU uncertainty. Russia’s USD 8 billion outflow highlights the impact of Western sanctions and geopolitical tensions.
Smaller economies like Estonia and Trinidad and Tobago endure sharp capital losses due to reliance on foreign investment and global market volatility, while Angola and Lesotho show signs of improvement despite still negative FDI, fueled by renewed interest in resource extraction and infrastructure projects that could attract fresh capital.
Ultimately, negative FDI is more than a warning sign, it offers a window into how global capital reallocates quickly in response to political tensions, economic policies, and changing investor confidence.
Final thoughts:
The 2024 foreign investment landscape reveals a decisive break from old patterns. While traditional powerhouses like the U.S. remain dominant in absolute terms, the fastest-growing and most efficient investment destinations are often small, agile economies with targeted strategies.
From Malta’s rise as a digital finance hub to Vietnam’s emergence in global electronics, capital is now chasing specialisation, stability, and scalable opportunity, not just GDP size.