A Commodity Approach
Dilki Wijesuriya
For a regional arrangement like South Asian Association for Regional Cooperation (SAARC), which is still at its infant stage, trade cooperation is the single most important item that can not only open the political and economic frontiers of these economies, but can also inject a high growth profile to this region.
A major strategy towards enhancing intra-SAARC trade could be a commodity approach wherein the national economies producing a common commodity at a somewhat comparative cost effectiveness, could come together to have some sort of a regional agreement on that specific commodity. This agreement can be aimed at encompassing the entire range of this specific commodity management including production, productivity, industrial management, technology and domestic as well as international marketing. Any such agreement should be based on very sound and clearcut mutually gainful matrices so that sustainability can be ensured.
One such identified commodity in South Asia is tea.

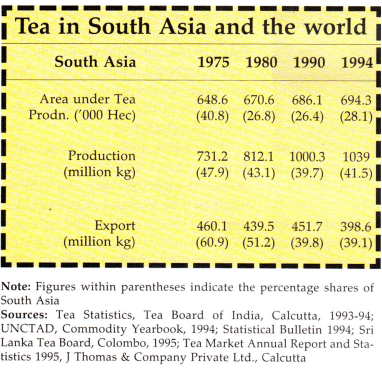
South Asia has about 26% of the area under total world tea production and produces about 42% of the total world production. It constitutes about 39% of the total world exports and realizes about 41% of the world total export realization from tea. However, almost all these variables have shown a declining trend over the years in their respective shares. For example, South Asia’s contribution to world total production of tea came down from almost 48% in 1975 to 42%. This is an alarming trend indicating the emergence of other regional giants in the arena of tea production.
Tea exports also fetch a good portion of the export revenues of the South Asian countries with Rs 9750 million for India (up from Rs 1223 million in 1960-61) and Rs 20964.1 million for Sri Lanka (up from Rs 1095.7 million) during 1994-95. However, as a percentage of total exports revenue it steadily came down for India from 19.04 to 1.18% and for Sri Lanka from 59.82% to 13.22% during the same period.
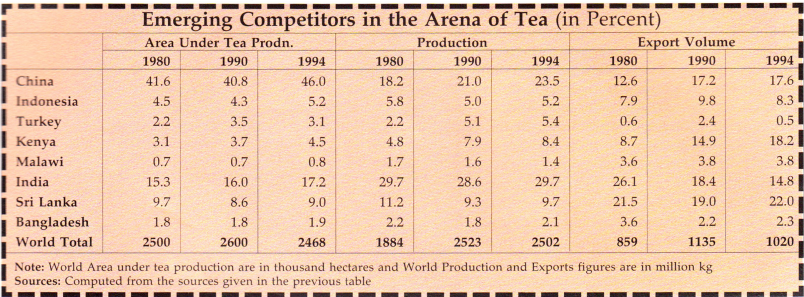
Competition to South Asia in the international tea market comes from two different categories of competitors i.e. traditional and non-traditional. It is the latter which has proved to be increasingly formidable for South Asia. Among the traditional competitors China and Indonesia continue to dominate the scene with some noticeable increase in their shares of total world exports. In fact, China’s relatively glaring pace of non- performance could be largely because of the very low yield per hectare which is hardly 450 kg as against India’s 1807 kg per hectare. This is also indicated by the fact that the area under tea cultivation in China has been as high as 46% of the world total, whereas its production has been hardly 23%.
On the other hand, Kenya has steadily forged ahead with more than double the increase in both production and exports in the last ten years. Today, Kenya alone exports about 18% of total world exports against 8.7% in 1980. The sharp fall in India’s exports from 26% in 1980 to 14.8% in 1994 is largely responsible for the decreased share of South Asia.

The 1990-94 average annual growth rate of tea production in India has been 2% as against 2% and 1.95% of Bangladesh and Sri Lanka, respectively. This is much in contrast to the 9% of Kenya and 6.7% of China. This alone gives us an idea about how steadily the Kenyans have been expanding their domestic production. Kenya has outstripped all others in terms of the average yield per hectare which is as high as 2115 kg as against India’s 1807 kg per hectare. Interestingly, Kenya lagged far behind India in 1980 with an average yield figure of 1174 kg per hectare as against India’s 1494 kg.
The emerging challenges become more fierce with the varying performance on the export front. In South Asia, it is only Sri Lanka which has recorded an average annual growth rate of 1.5% as against India’s negative growth rate of 2.33% and Bangladesh’s 1.69% during the 1980-94 period. Whereas for Kenya, the export growth rate has been 10.34% per annum which is relatively much more spectacular. For that matter even China has recorded a growth rate of 4.74%.
Tea has a very expansive market in South Asia itself. It is roughly estimated that South Asia alone consumes about 750-800 million kg of tea per annum. Though the per capita consumption has been comparatively much lower in the region, most of the countries in the region have shown a definite increasing trend in its consumption. However, Pakistan a major importer of tea in the world has been importing an over- whelming proportion of its domestic requirements from countries outside the region.
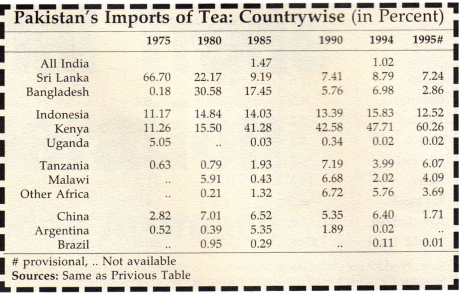
Pakistan’s tea imports have steadily grown from 51 million kg in 1975 to 124 million kg in 1994 thereby coming into the category of top 3 importers with 11.06% share in the total world tea imports. However, South Asia’s contribution to this hefty quantity of tea imports of Pakistan has been appallingly minimum, particularly in the last 15 years. It literally nosedived from a significant share of 67% in 1975 to 17% in 1994. Within this import from South Asia also, the share of Sri Lanka in Pakistan’s total import used to be as high as 66% which stands at hardly 9% in 1994. This is adequately reflected in absolute terms also. Ironically, South Asia has been both the largest producer and geographically the nearest possible tea producer for Pakistan.
India has never been a source of tea import for Pakistan. The available data indicate that it has never imported more than 1.5% (maximum being 2.1 million kg in 1992 out of its total imports of 120 million kg) of its total imports from India. However, the import from Bangladesh has jumped from 92 thousand kg in 1975 to 8 million kg in 1994 i.e., an expansion from about 0.18% of its total imports to 6.9%.
Kenya has gradually emerged as the most vital source of Pakistan’s imports with it bagging over 60% in 1995 as against a meagre 11% in 1975. The shares of other traditional sources like Indonesia have remained more or less intact whereas the Chinese share has shown a declining trend with 1.71% in 1995. Interestingly, Tanzania with over 6% contribution is also emerging as another important source of tea for Pakistan.
In fact, Pakistan has been importing tea from sources outside the region at a much higher cost than from within the region. As per the 1985 data the unit prize realization of Indian tea exported to Pakistan worked out to be US$2.42 per kg as compared to Kenya’s US$3.35, Indonesia’s US$2.98, Sri Lanka’s US$2.90 and Bangladesh’s US$2.46. If Pakistan had imported all 67.8 million kg (it’s total import from India, Kenya, Bangladesh, Indonesia and Sri Lanka together in 1985) instead of only 1.19 million kg from India alone, it would have saved a hefty amount of US$41.8 million. Similarly if it had imported all instead of 7.47 million kg from Sri Lanka alone it would have kept intact with itself net foreign exchange of US$9.2 million.
Meanwhile, new challenges have appeared before the South Asian tea producers. These have taken both tariff and non-tariff dimensions, the latter being more serious as many of the erstwhile major importers particularly from western Europe have invariably raised
issues like pesticide residues in tea. Both India and Sri Lanka have over the years developed a comprehensive marketing infrastructure abroad. If these operations can be combined, it will go a long way in consolidating the maet control which is largely confined to the multinational corporations at the moment. This will have made their operations cost effective. This proposal of joint marketing should aim at not only diversification of buyer countries but also the diversification of the final product into more sought-after forms like instant tea, scented tea and other value- added items. This requires a great deal of joint effort.

However, the cost of production too has become more critical in the face of pressure brought about by low prices both in the domestic and world market. The steadily escalating costs and the cascading effects of various duties have had its adverse impact on the revenue earnings with many of the industries forced to run on losses and go for ‘garden lock up.’ In Sri Lanka, the labor cost account for over 50% of the cost of production. The average cost of production stood at Rs 79.14 per kg (Indian Rs 51) in Sri Lanka as against India’s Rs 45 in 1994. This becomes more contrasting if one compares the labor productivity across the region. An average of 768 kg has been per labor production in India within which we find the highest in Tamil Nadu (1149 kg) and a low of 280 kg per labor in the world famous tea gardens of Darjeeling.
In the last few years, in order to rejuvenate the tea industry, the most regressive taxes on the tea industry in Sri Lanka like export duty and ad valorem tax have been phased out and abolished. These taxes fetched as high as US$207 million in 1984 which has now come down to as low as US$9.5 million. Similarly in Bangladesh besides a 1% tea cess, there is value added tax at 15% of auction price of tea. Though the excise duty on tea was abolished in India in 1993, the tea cess continues to be there along with a varying rate of sales tax in different states.
Of late, for almost all the South Asian countries the foreign direct investment (FDI) has become the most focused area of economic reforms, though they have a widely varying FDI policy which could ultimately lead to fierce competition among these countries for the regional market. In Pakistan, no industrial sanction is needed in most cases (except arms ammunition, high explosives etc) of FDI, so is the case with Sri Lanka whereas in India and Bangladesh the services sector including railways, banks, insurance continue to remain beyond their purview. A landlocked country like Nepal also has recorded a manifold jump in the FDI participation with 126 operational units and as many as 29 under construction, 90 licensed and 38 approved units in December 1995.
During 1990 – May 1996 Sri Lanka had operational and approved FDI projects numbering 1531 with an estimated foreign investment of Rs 207.1 billion. The joint ventures both with regional and overseas partners have already been initiated in Nepal with Goodricke from London and in Sri Lanka with Tata from India. Besides production, Bhutan could be a very ideal source of packaging materials like tea chests.
In Sri Lanka, the entire plantation policy so far dominated by two large state-owned corporations viz. Sri Lanka State Plantations Corporation and Janatha Estates Development Board, has undergone a perceptible structural change in the last few years. In 1995, the Government under its privatization drive, commenced the extension of the current five year lease contracts for private management (initiated in 1992) of the state-owned Regional Plantations Companies (RPCs) to 53 years mainly to encourage the private management to invest in capital expenditure. These 23 RPCs are managed by private companies on a profit sharing basis and are able to improve productivity and contain cost of production increases. Of late, ten RPCs are earmarked for long-term leasing where 52% of the total shares in the profit making RPCs will be sold to the company managing the RPCs.
It is of strategic necessity for SAARC to vocally address itself to these issues of regional investments so that the cream of business and industrial activities. remains in the region. The SAARC Fund for Regional Projects established in 1991 mainly to make funds. available for identification and development of regional projects could concretize some of the tea ventures on a sub-regional framework wherein the potential belts of North East India, southern belt of Bhutan, south eastern belt of Nepal and north west and north east belt of Bangladesh could be converted into ‘tea rectangles” that would be facilitated by the already existing technology, tea research institutions, market infrastructures and the labor market in this particular region.
(Courtesy: Regional Economic Cooperation on South Asia: A Commodity Approach, By Mahendra P Lama)


